reading-notes
Docs for the HTML <canvas> Element & Chart.js
Charts are far better for displaying data visually than tables and have the added benefit that no one is ever going to press-gang them into use as a layout tool.
- A great way to get started with charts is with Chart.js, a JavaScript plugin that uses HTML5’s canvas element to draw the graph onto the page.
Setting up:
<script src='Chart.min.js'></script>
Drawing a line char:t
<canvas id="buyers" width="600" height="400"></canvas>
Drawing a pie chart:
<canvas id="countries" width="600" height="400"></canvas>
Drawing a bar chart:
<canvas id="income" width="600" height="400"></canvas>
Basic usage of canvas
At first sight a <canvas> looks like the element, with the only clear difference being that it doesn’t have the src and alt attributes. Indeed, the <canvas> element has only two attributes, width and height.
-
The <canvas> element can be styled just like any normal image
- Fallback content: content to be displayed by browsers don’t support <canvas>.
- Required </canvas> tag
The rendering context
The <canvas> element creates a fixed-size drawing surface that exposes one or more rendering contexts, which are used to create and manipulate the content shown.
Checking for support
The fallback content is displayed in browsers which do not support
Drawing shapes with canvas
- The grid
-
Drawing rectangles <canvas> only supports two primitive shapes: rectangles and paths
fillRect(x, y, width, height)Draws a filled rectangle.strokeRect(x, y, width, height)Draws a rectangular outline.clearRect(x, y, width, height)Clears the specified rectangular area, making it fully transparent. - Drawing paths
- First, you create the path.
- Then you use drawing commands to draw into the path.
- Once the path has been created, you can stroke or fill the path to render it.
functions used to perform these steps:
beginPath()Creates a new path. Once created, future drawing commands are directed into the path and used to build the path up.Path methodsMethods to set different paths for objects.closePath()Adds a straight line to the path, going to the start of the current sub-path.stroke()Draws the shape by stroking its outline.fill()Draws a solid shape by filling the path’s content area.
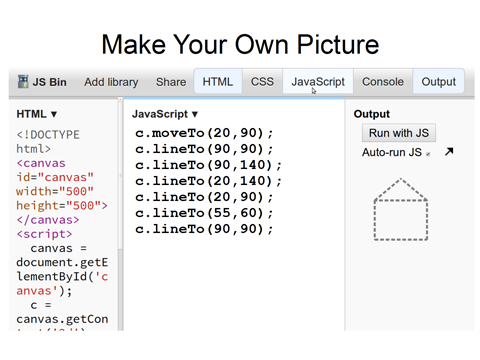
- Drawing a triangle
moveTo(x, y)Moves the pen to the coordinates specified by x and y.
(
## Applying styles and colors
- Colors
- fillStyle = color Sets the style used when filling shapes.
- strokeStyle = color Sets the style for shapes’ outlines.
- Transparency In addition to drawing opaque shapes to the canvas, we can also draw semi-transparent (or translucent) shapes. This is done by either setting the globalAlpha property or by assigning a semi-transparent color to the stroke and/or fill style.
globalAlpha = transparencyValue Applies the specified transparency value to all future shapes drawn on the canvas. The value must be between 0.0 (fully transparent) to 1.0 (fully opaque). This value is 1.0 (fully opaque) by default.
- Line styles There are several properties which allow us to style lines.
- lineWidth = value Sets the width of lines drawn in the future.
- lineCap = type Sets the appearance of the ends of lines.
- lineJoin = type Sets the appearance of the “corners” where lines meet.
## Drawing text
The canvas rendering context provides two methods to render text:
fillText(text, x, y [, maxWidth])Fills a given text at the given (x,y) position. Optionally with a maximum width to draw.strokeText(text, x, y [, maxWidth])Strokes a given text at the given (x,y) position. Optionally with a maximum width to draw.
- Styling text In the examples above we are already making use of the font property to make the text a bit larger than the default size. There are some more properties which let you adjust the way the text gets displayed on the canvas:
- font = value The current text style being used when drawing text. This string uses the same syntax as the CSS font property. The default font is 10px sans-serif.
- textAlign = value Text alignment setting. Possible values: start, end, left, right or center. The default value is start.
- textBaseline = value Baseline alignment setting. Possible values: top, hanging, middle, alphabetic, ideographic, bottom. The default value is alphabetic.
- direction = value Directionality. Possible values: ltr, rtl, inherit. The default value is inherit.